WhatsUp Gold Technology
Alert CenterIf you’re like most network managers, you probably spend a lot of time with your network management tool’s alerting, troubleshooting and escalation workflow features. After all, you need to know what’s on your network, what level of monitoring is in place, the current status and prioritization of alert messages, and who has ownership of the problem. You would want everything that needs your immediate attention be presented right up front, so you can address it quickly and efficiently. After all, the purpose of a network management tool’s alerting component is to inform you in real time of failures and impending issues so that you can remediate them before they adversely affect business. A well-designed tool should make alerting effortless, providing information to you in an easy, intuitive, and actionable way.
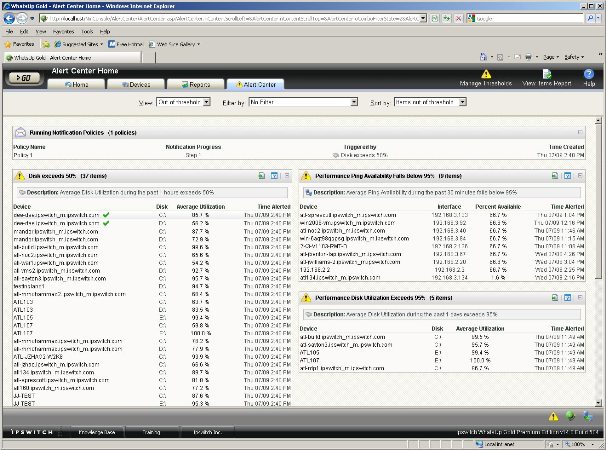
WhatsUp Gold’s new Alert Center functionality can do all this and more. It provides a single integrated workspace that consolidates all alerts, notifications and alert acknowledgements for easy configuration and management. You can easily alert on performance monitors, passive monitors and WhatsUp Gold Flow Monitor (plug-in required). It can be configured to include or exclude devices and groups for any of the threshold, alerts and notifications. And existing performance, custom and passive monitors configured in WhatsUp Gold are automatically brought into Alert Center and can be configured with thresholds.
In fact, Alert Center sets a new bar in alert management by introducing a level of operational usability not found anywhere else. And it is included for free in all WhatsUp Gold versions (Standard, Premium, Distributed and MSP)!
With WhatsUp Gold Alert Center in place, you can:
- Set up flexible, user configured thresholds for different performance parameters
- Configure new notification policies based on device and system criticality
- View reports on all configured monitors, running notification policies and event logs
- Coordinate alert response via acknowledgements and multiple levels of escalations
- Monitor and manage the WhatsUp Gold installation for performance
Key features of the WhatsUp Gold Alert Center include:
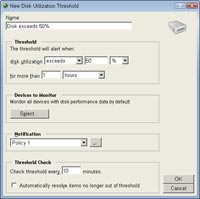 Configurable Thresholds
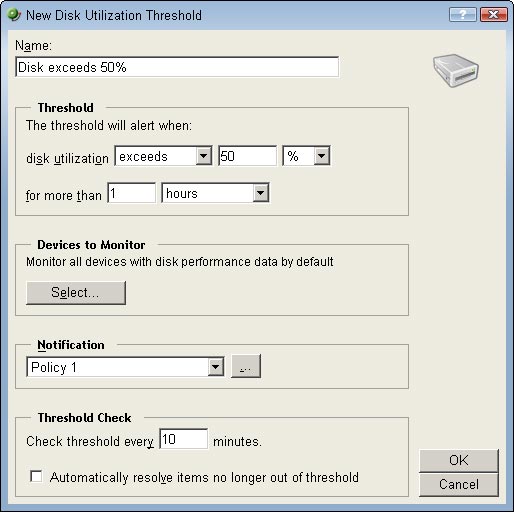
Alert Center enables network managers to easily configure, set and modify thresholds for monitored resources. Threshold settings include defining minimum or maximum accepted values and the time duration before an alert is triggered. For example, a systems administrator can configure a CPU threshold that will alert if a server CPU exceeds and maintains more than 90% utilization for a period of 5 minutes or more.
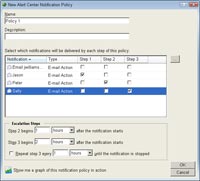
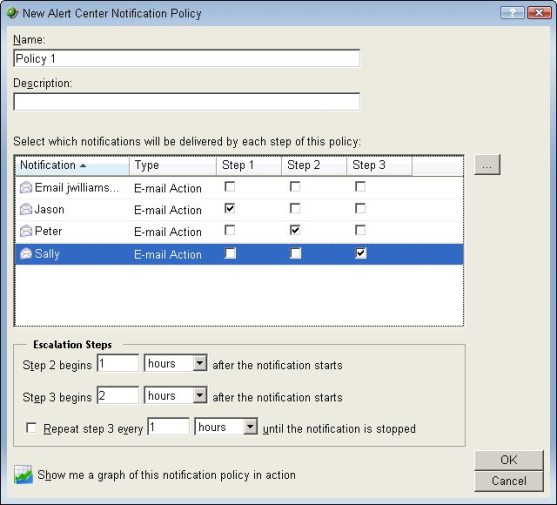
Notification Policies
Network managers can define and implement notification policies based upon the criticality of a device or system within Alert Center. Notification policies may include multiple escalation steps based upon user-specified intervals. If a problem is not addressed in the specified timeframe, the next level of notification alerts is sent out to designated individuals or even Help Desk systems (for automatic trouble ticket generation) via email. This ensures that critical problems have the right management attention and pending issues don’t fall through the cracks. After a problem has been resolved, other users can be notified of the resolution and subsequent steps of a running notification policy are halted.
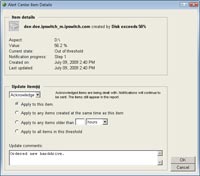 Alert Acknowledgements
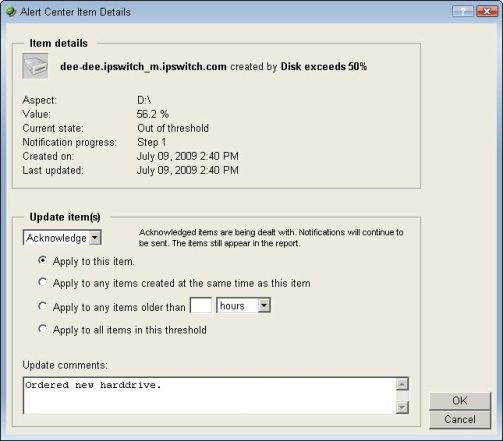
Alert Acknowledgements in Alert Center allows network managers to respond to alerts, provide status and acknowledge ownership of the resolution process. When first responders acknowledge alerts, it indicates that the specific system or device is being worked on. No further notifications are sent unless triggered by the escalation policy. When the issue is resolved, designated team members in the escalation path are notified and the device is again available for future monitoring and alerting. Notes detailing the actions taken can be added to the acknowledgement process, providing the operations staff with quick access to problem resolution data, in the event a problem reoccurs.
WhatsUp Gold Self Monitoring
In a monitoring environment, the management system itself can be a singular point of failure. Alert Center provides detailed visibility into the application health of the WhatsUp Gold installation itself. By enabling self-monitoring of the WhatsUp Gold Server and Flow Monitor health, Alert Center minimizes risk of missing key infrastructure events due to management system unavailability. Key reporting areas include performance of the WhatsUp Gold database (either local or remote), WhatsUp Gold services and Flow Monitor status. System administrators can use recommended thresholds delivered out-of-the-box, or configure new thresholds and notifications as required.
Flow Monitor Thresholds
If Flow Monitor is installed, Alert center enables setting up of multiple configurable thresholds tracking the volume of traffic between conversation pairs, failed connections per host, top senders and receivers, and specific interfaces over a set time period. Custom monitors with configurable thresholds can provide more granular tracking of specific aspects of network traffic including host, protocol, application, domain, location and other flow parameters.
 Alert Center Reports
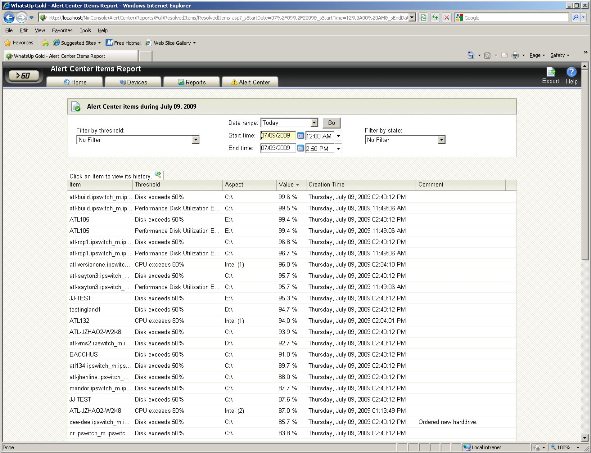
Alert Center reports are used to troubleshoot and monitor individual alerts as well as for historical archival that can support IT process audits. They can be accessed from either the Reports tab or the Alert Center tab in the main WhatsUp Gold console.
Three core reports are available, including:
- Items Report – displays all configured monitors and their status
- Running Notification Policies – displays all configured notification policies and their associated monitors
- Log Report – logs and displays all events as well as information on alert acknowledgements and resolutions.
Alert Ceneter Benefits:
With Alert Center, network and systems managers benefit from higher productivity, better collaboration and faster recovery from device downtime or system performance issues. Since Alert Center threshold and notification settings can be applied to either individual or groups of devices, it saves valuable time and effort in building and maintaining organization wide policies. Easy access to threshold report workspaces from the Alert Center also enables editing of configured parameters directly from the WhatsUp Gold web portal.
Quick and Easy Configuration
Alert Center settings are accessible from a single console making bulk updates to thresholds and monitor parameters quick and easy. Threshold configurations and notification policies once defined can be applied across multiple devices or groups. This saves valuable time and effort in locating and setting parameters for multiple passive or performance monitors.
Consolidated Reporting and Coordinated Action
Consolidated alert listings in Alert Center, provide a global view of events as they occur. Network and systems administrators can acknowledge alerts, initiate troubleshooting action and update problem status with comments. This enables other team members to follow progress and support quicker, coordinated resolution of business impacting issues. Logged information on alerts, acknowledgements, and their resolution may also be used for conducting IT process audits at a later time.
 Multi-Level Policy Based Escalation
Alert Center allows set up of multi-level policy based escalation. When critical devices are impaired or identified issues are not responded to within timeframes specified in the Service Level Agreement (SLA), business and IT stakeholders may be notified via email notifications. Email alerts may also be used to automatically open trouble tickets in Help Desk systems. This enables network managers to draw management attention and marshal additional resources that can help speed up triage and resolution.
Scalable Traffic Monitoring for Security and Performance
Alert Center adds configurable alerting capability to Flow Monitor enabling network managers to identify specific application behaviors and traffic patterns that may impair business operations. For example, high number of network conversations from a single host may indicate the occurrence of a virus attack. Similarly, high volume of network traffic to a particular destination may signify unauthorized video or streaming downloads that may slow down other business applications traversing the same segment. Alert Center enables the network team to manage a significantly high volume of traffic information without becoming overwhelmed.
24/7 Visibility and Monitoring Oversight
Alert Center helps optimize the performance of the WhatsUp Gold server and Flow Center plug-in 24/7. Network managers can proactively deal with installation issues arising from database overload, monitor or alert volumes and other system performance characteristics. This improves overall network uptime and performance as there is less likelihood of monitoring blackout periods or data loss – when visibility into the environment is lost because of performance issues with the WhatsUp Gold installation.