 Overview:
VMware provides organizations with the flexibility to quickly provision server capacity to meet changes in server demand. It reduces hardware costs and total cost of ownership – but it also introduces a layer of complexity for IT in delivering the availability and performance demanded by users, applications and the business. System admins need real-time and historical visibility into the performance of their virtual infrastructure. They need to analyze virtual performance in the context of the entire IT infrastructure – networks, physical servers and applications.
To address these needs, WhatsVirtual discovers, maps, monitors, alerts and reports on VMware performance for ESX and ESXi hosts and guests. It is a plug-in for the WhatsUp Gold suite of IT monitoring solutions, delivering an integrated view of the entire IT infrastructure.
Minimize troubleshooting
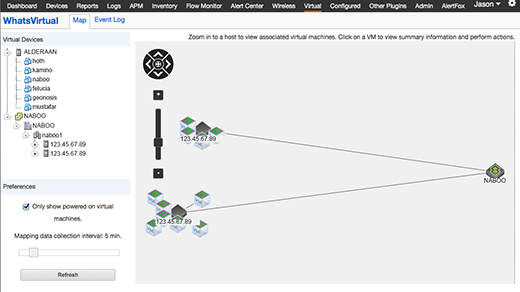
Easily trace the root cause of problems anywhere in your infrastructure by viewing relationships between a host system and its associated VMs, even if they are suspended or after a live migration.
Monitor physical and virtual servers from a single, unified dashboard, including virtual machines as they move across servers.
Increase uptime, improve reliability and cut costs
Automatically discover, map and document physical servers and virtual resources, virtual clusters, vCenter server, and VMware ESXi host and guest virtual machine roles to see your entire infrastructure.
Improve your vCenter’s uptime and reliability using virtualization maps, collect performance metrics, access key server monitoring tasks through integration with the VMware API. Automatically group and map ESXi hosts and all associated virtual machines so you can easily visualize relationships.
See your VMware environment’s health, availability and performance
Oversee health, availability and performance of VMware vCenter Servers and monitor virtual server performance and resource consumption of VMware ESX hosts and guests.
Automatically discover and map all virtual assets: clusters, hosts and guests using VIM. Track live virtual machine migrations in real-time, and understand virtual to physical relationships at all times with dynamic LiveMaps.
System Requirements:
- Processor: Quad-Core 2.4 GHz
- Memory: 8 GB
- Storage (installation): 15 GB
- NIC: 100 Mbps
- Operating System: Windows Server 2008 R2 (32-bit or 64-bit) or higher
- Database: SQL Server Express 2008 R2 (32-bit or 64-bit) or higher
Out-of-the-box reports for your virtual environments
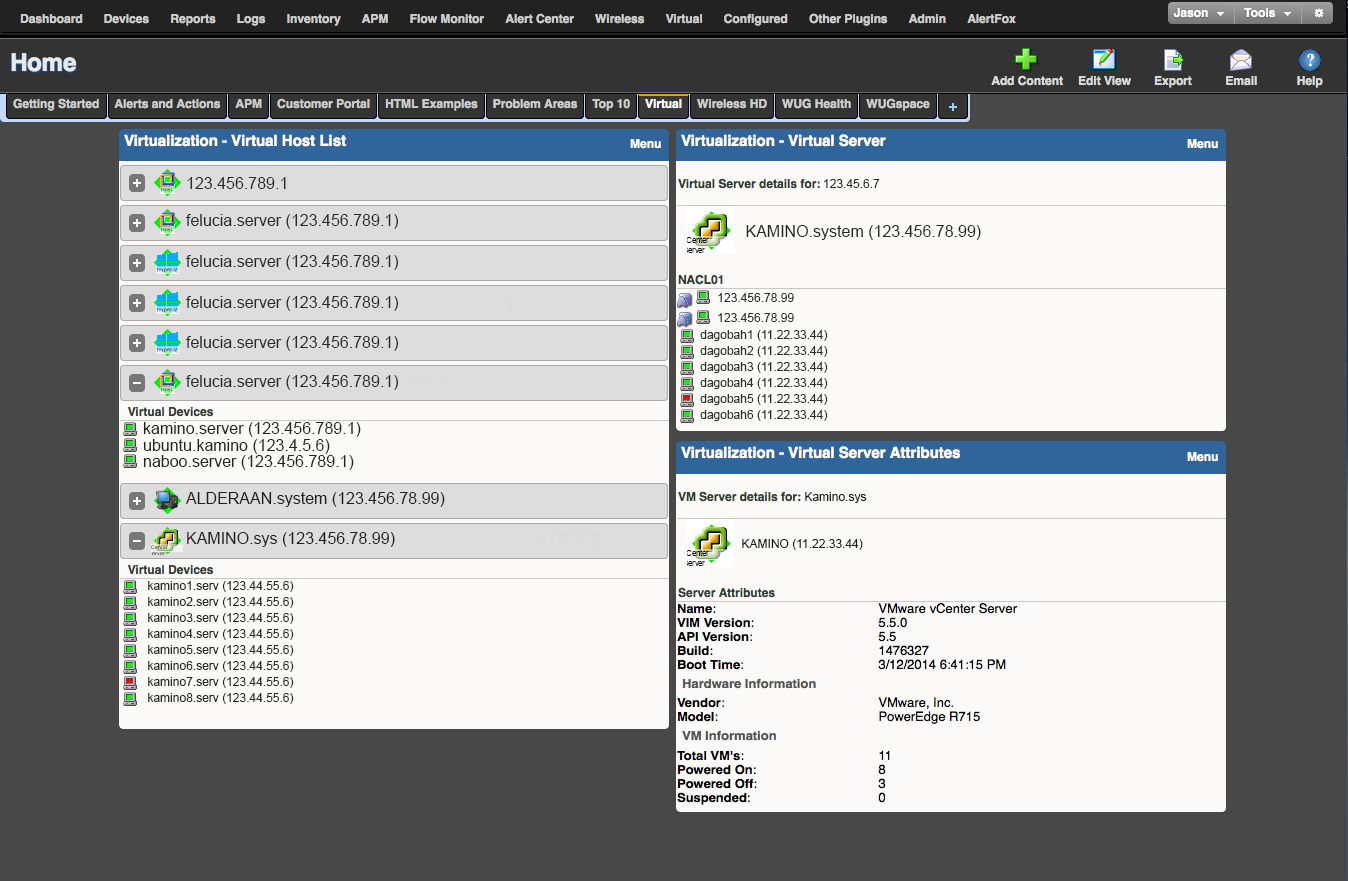
Get VM-specific dashboard reports like Virtual Host lists, Virtual Host attributes or Virtual Cluster groups.
The Virtual Host List report details the name and IP address of the VMware ESXi host machine and all associated virtual machines. Virtual Host Attributes report displays all the host server details, including running configuration of the server (for example, VMware ESXi and its version), the build number and boot time. Extensive individual server performance reporting, including CPU, memory, disk and network interface utilization metrics to virtual machines provides superior visibility into your VM environment. Reports show resource (e.g. CPU, memory, disk, network interface) allocation and consumption by the host and associated virtual guest machine. All data collected by WhatsVirtual uses FIPS 140-2 compliant algorithms for data integrity and privacy. You can always customize these reports or create new reports to match your specialized requirements.
Improve visibility into your VM environment
Improve visibility through VM-specific dashboard reports like Virtual Host lists, Virtual Host attributes or Virtual Cluster groups.
The Virtual Host List report details the name and IP address of the VMware ESXi host machine and all associated virtual machines. Virtual Host Attributes report displays all the host server details, the build number and boot time. Gain visibility into your VM environment like never before with individual server performance reports that include CPU, memory, disk and network interface utilization metrics to virtual machines. Understand resource (e.g. CPU, memory, disk, network interface) allocation and consumption by the host and associated virtual guest machine. You can customize these reports or create new reports to match your specialized requirements.
Stay ahead of problems with alerts
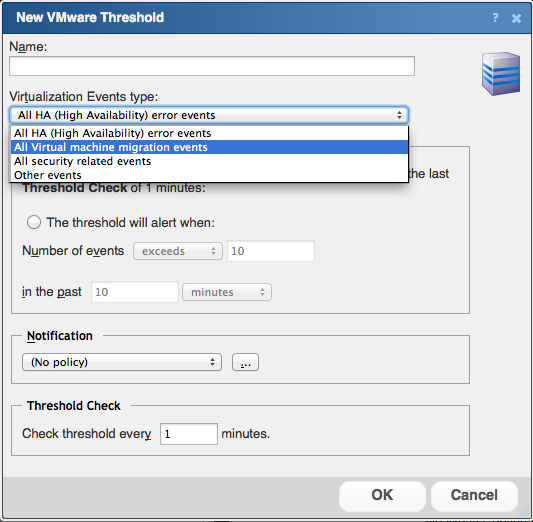
WhatsVirtual generates alerts for events to help you resolve problems before users are impacted.
Alerts may be triggered by an occurrence of an event or by the crossing of a threshold value and can be configured so the right people are notified at the right time. Alerts can be sent via email, SMS, and appear on-screen.
Features & Benefits:
Features
Advanced Capabilities for VMware Virtual Server Monitoring
WhatsVirtual is a newer plug-in to the WhatsUp Gold core platform that allows you to discover, map, monitor and manage your VMware virtual server environment exactly in the same way and from the same console as your physical server infrastructure, applications and network devices. Key features include the following
WhatsVirtual Basics
- Fully integrates into WhatsUp Gold versions – Standard, Premium, and Distributed v14.3 and upwards for single console operation of all infrastructure and applications
- Natively integrates with the VMware API ( based on the VMware vSphere Web Services SDK) to manage VMware ESXi v3.5 and upwards
- Oversees health, availability and performance of VMware vCenter Servers, the heart of your VMware investment
- VMware vCenter, vMotion and High Availability support
- Seamless discovers all physical and virtual resources deployed in your environment
- Displays virtual server performance seamlessly along with information from your physical servers
- Tracks live virtual machines migrations in real-time, and understand virtual to physical relations at all times
- Automatically groups and maps ESXi hosts and all associated virtual machines for easy visualization of relationships
- Supports all existing WhatsUp Gold Alert Center workflows and threshold configuration capabilities for rapid problem identification and resolution anywhere in your infrastructure
WhatsVirtual Reporting
- Virtual Host List report details the name and IP address of the VMware ESXi host machine and all associated virtual machines.
- Virtual Host Attributes report displays all the host server details including running configuration of the server (for example, VMware ESXi and its version), the build number and boot time
- Extends individual server performance reporting including CPU, Memory, Disk and Network Interface utilization metrics to virtual machines
- New workspace reports by resource shows resource (e.g. CPU, Memory, Disk, Network Interface) allocation and consumption by the host and associated guest machines
WhatsVirtual Management Actions
- Supports new VMware actions for multiple management tasks including –
- Power On
- Power Off
- Suspend
- Reset
- Shutdown Guest
- Reset Guest
- Take Snapshot (back up of virtual machine image)
- New WhatsUp Gold Action library elements to support automated and schedule execution of VMware management tasks
Others
- WhatsVirtual is backed by the WhatsUp Gold technical support team (via phone or email)
Benefits
Harness Virtualization Benefits with Minimum Management Hassle
- Easy to use, centralized and consolidated management of physical and virtual server infrastructure – no “swivel chair” operations required
- Saves time, effort and complexity of coordinating between and managing multiple monitoring tools
- Accurate and up-to-date reporting of performance and availability information of virtual server infrastructure ensuring the right decision support for operations
- Native integration with the VMware API (including support for vCenter, VMware vMotion & VMware High Availability) ensures that the right metrics and VM to physical server relationships are discovered, monitored and reported
- Powerful management actions that ensure higher uptime, reliability and lower costs
- The ability to start/stop/suspend and reset virtual infrastructure ensures that server workloads stay in tune with application demand
- Single console monitoring, alerting, reporting and management of the entire datacenter infrastructure enabling faster correlation and resolution of infrastructure issues
- Including physical and virtual servers, network devices, applications and traffic monitoring and analysis
- Faster and proactive resolution saves valuable time and money and enables network and system managers to focus on other critical tasks
FAQ:
What is Virtualization?
Virtualization is the abstraction of computing resources decoupled from their physical capacities. Server virtualization enables running one or more “virtual machines” (commonly called a ‘guest’) on a single physical server (commonly called the ‘host’). A virtual machine (VM) is a software implementation of the server that acts just like a real machine.
How does Virtualization work?
Each virtual machine (VM) operates just like an independent server with its own guest operating system (Windows or Linux as examples) running one or more applications, with a designated amount of CPU, memory, disk and network resources. Each of the VM’s is isolated from one another other; so for example, if one of them crashes, it does not affect any of the other VM’s running on the same host server.
The VM’s and their guest operating systems run on the top of a specialized software called the “hypervisor” or the VMM (Virtual Machine Monitor). The hypervisor acts as a sandwich layer between the VM’s and the physical hardware. It is responsible for intercepting calls from the guest operating systems of the VM’s to the hardware and managing them in a way, that each VM sees itself running independently on the allocated hardware resources. A hypervisor can provide the virtualized abstraction of the physical hardware including CPU, memory, storage and network I/O resources as well as access to all necessary system drivers.
Why doesn’t SNMP monitoring work in Virtualized environments?
SNMP was originally designed to manage hardware devices with a well defined MIB structure and definitive resource capacities. In a virtualized system, capacities are elastic (they can be made to grow or shrink dynamically) and full VM’s can be started/stopped or migrated from one hardware to another while maintaining their system state. In this dynamic environment, the rigid MIB and OID structure of SNMP is not suitable.
Further, the use of an intermediate hypervisor layer hinders the view into actual VM resource consumptions. For example, more memory may be allocated to VM’s than is physically available – through “Memory Over Commitment” or “Transparent Page Sharing” features provided by VMware. Hence, SNMP based reporting, whether through agents or in agent less modes report incorrect results of resource performance metrics and have only limited or no management information support from virtualization vendors. In fact, VMware has discontinued SNMP based performance data publishing altogether in their next generation ESXi systems. Monitoring of ESX servers with SNMP has other complications and needs detailed configuration as even the limited SNMP information is not published via the standard snmpd port.
What Virtualization Platforms does WhatsVirtual Currently Support?
WhatsVirtual currently supports the VMware ESXi 3.5 and later virtualization host systems. These are available free from VMware (for example, ESXi can be downloaded for free) and can also be purchased as part of their vSphere offering which provides robust capabilities for provisioning and maintenance of virtual server infrastructure.
Future versions of WhatsVirtual will support additional vendor systems providing heterogeneous support of virtual infrastructure.
What version of WhatsUp Gold do I need to use WhatsVirtual?
WhatsVirtual is a separately licensed plug-in and is available to customers for either evaluation or purchase. The plug-in requires the latest version of WhatsUp Gold as a base system.
-thumb.png)